
Cardiovascular Risk
Prediction System
A cardiovascular risk prediction model trained on patient records from the Michigan Medicine Precision Health EHR dataset.
Imagine if you could see your cardiovascular risk not once a year during a check-up, but every day.
Cardiovascular disease (CVD) remains the #1 global cause of death, responsible for nearly one-third of annual fatalities. Traditional risk scores such as Framingham and ASCVD are calculated from a single static snapshot of clinical data. They identify who is high-risk, but not when someone is drifting toward danger in real time.
Meanwhile, wearable devices continuously capture heart-rate trends, sleep regularity, and physical activity patterns, revealing the subtle rhythms of physiology and behavior that shape long-term risk. In this project, I reconstruct clinical risk scores from these real-world signals, turning yearly snapshots into a daily, behavior-aware estimate.
Toward continuous, personalized prevention, making cardiovascular risk tracking more timely, actionable, and grounded in everyday life.

Objective
Build a continuous cardiovascular risk scoring system that reconstructs validated clinical risk scores using large-scale EHR data and behavior-linked physiological markers, with model interpretability exposed through SHAP-based explanations.
Methods
End-to-End Modeling Pipeline
missing, outliers, coding
aggregation, scaling, encoding
Linear Regression
hyperparameter tuning
stability validation
individual risk drivers
Data Inputs
33K+ longitudinal records combining wearable-derived metrics (resting heart rate, activity, sleep) and key clinical indicators (BMI, diabetes, hypertension, heart failure).
Modeling
Started with a linear regression baseline (R² ≈ 0.20). Early XGBoost runs overfit, so the outcome was log-transformed and regularized, yielding consistent performance (mean cross-validated R² ≈ 0.63).
Interpretation
SHAP values quantify individual-level risk drivers, exposing nonlinear effects of physiologic and lifestyle-linked predictors and enabling readable explanations.
Outcome
A behavior-aware risk estimate that updates more frequently than static clinic-based scores, supporting early detection and preventive digital health intervention design.
Findings
Visualizing and interpreting the model’s internal logic and output distribution.
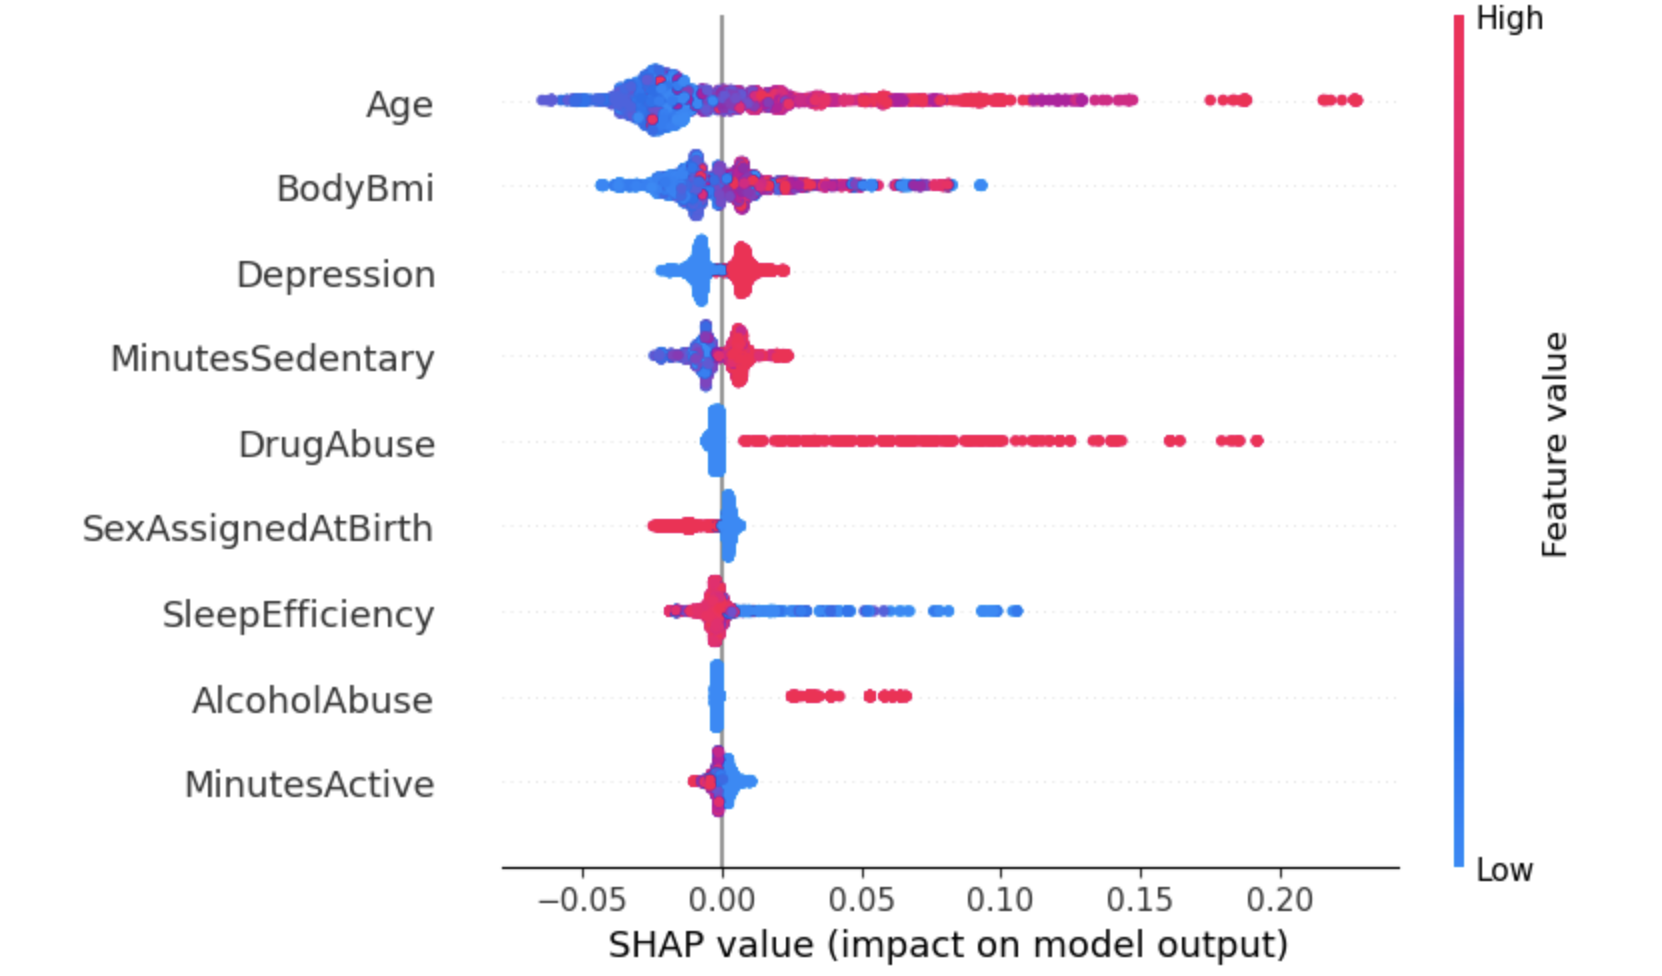
Feature Contributions
- Each point represents one patient; the x-axis shows SHAP value (feature impact).
- Red = higher feature values (e.g., older age, higher BMI) → higher risk.
- Blue = lower values → often protective.
- Key drivers include Age, BMI, Sleep Efficiency, and Substance Use.
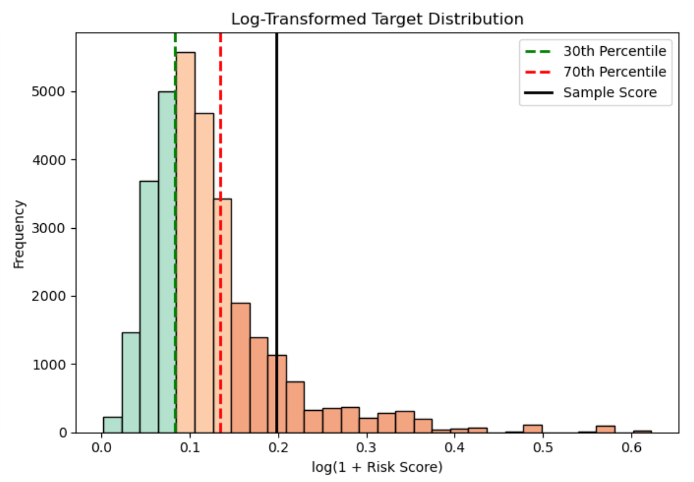
Risk Score Distribution
- Predicted cardiovascular risk scores remain right-skewed after log transformation.
- 30th & 70th percentiles define Low, Medium, and High risk tiers.
- Interpretability helps clinicians monitor risk trajectories over time.
Impact & Next Steps
The study underscores the potential of interpretable AI in preventive cardiology. Although the model was trained using single-institution data, future validation across heterogeneous populations is warranted. Further work will focus on integrating longitudinal EHR and wearable data to enable continuous, clinically actionable risk monitoring.